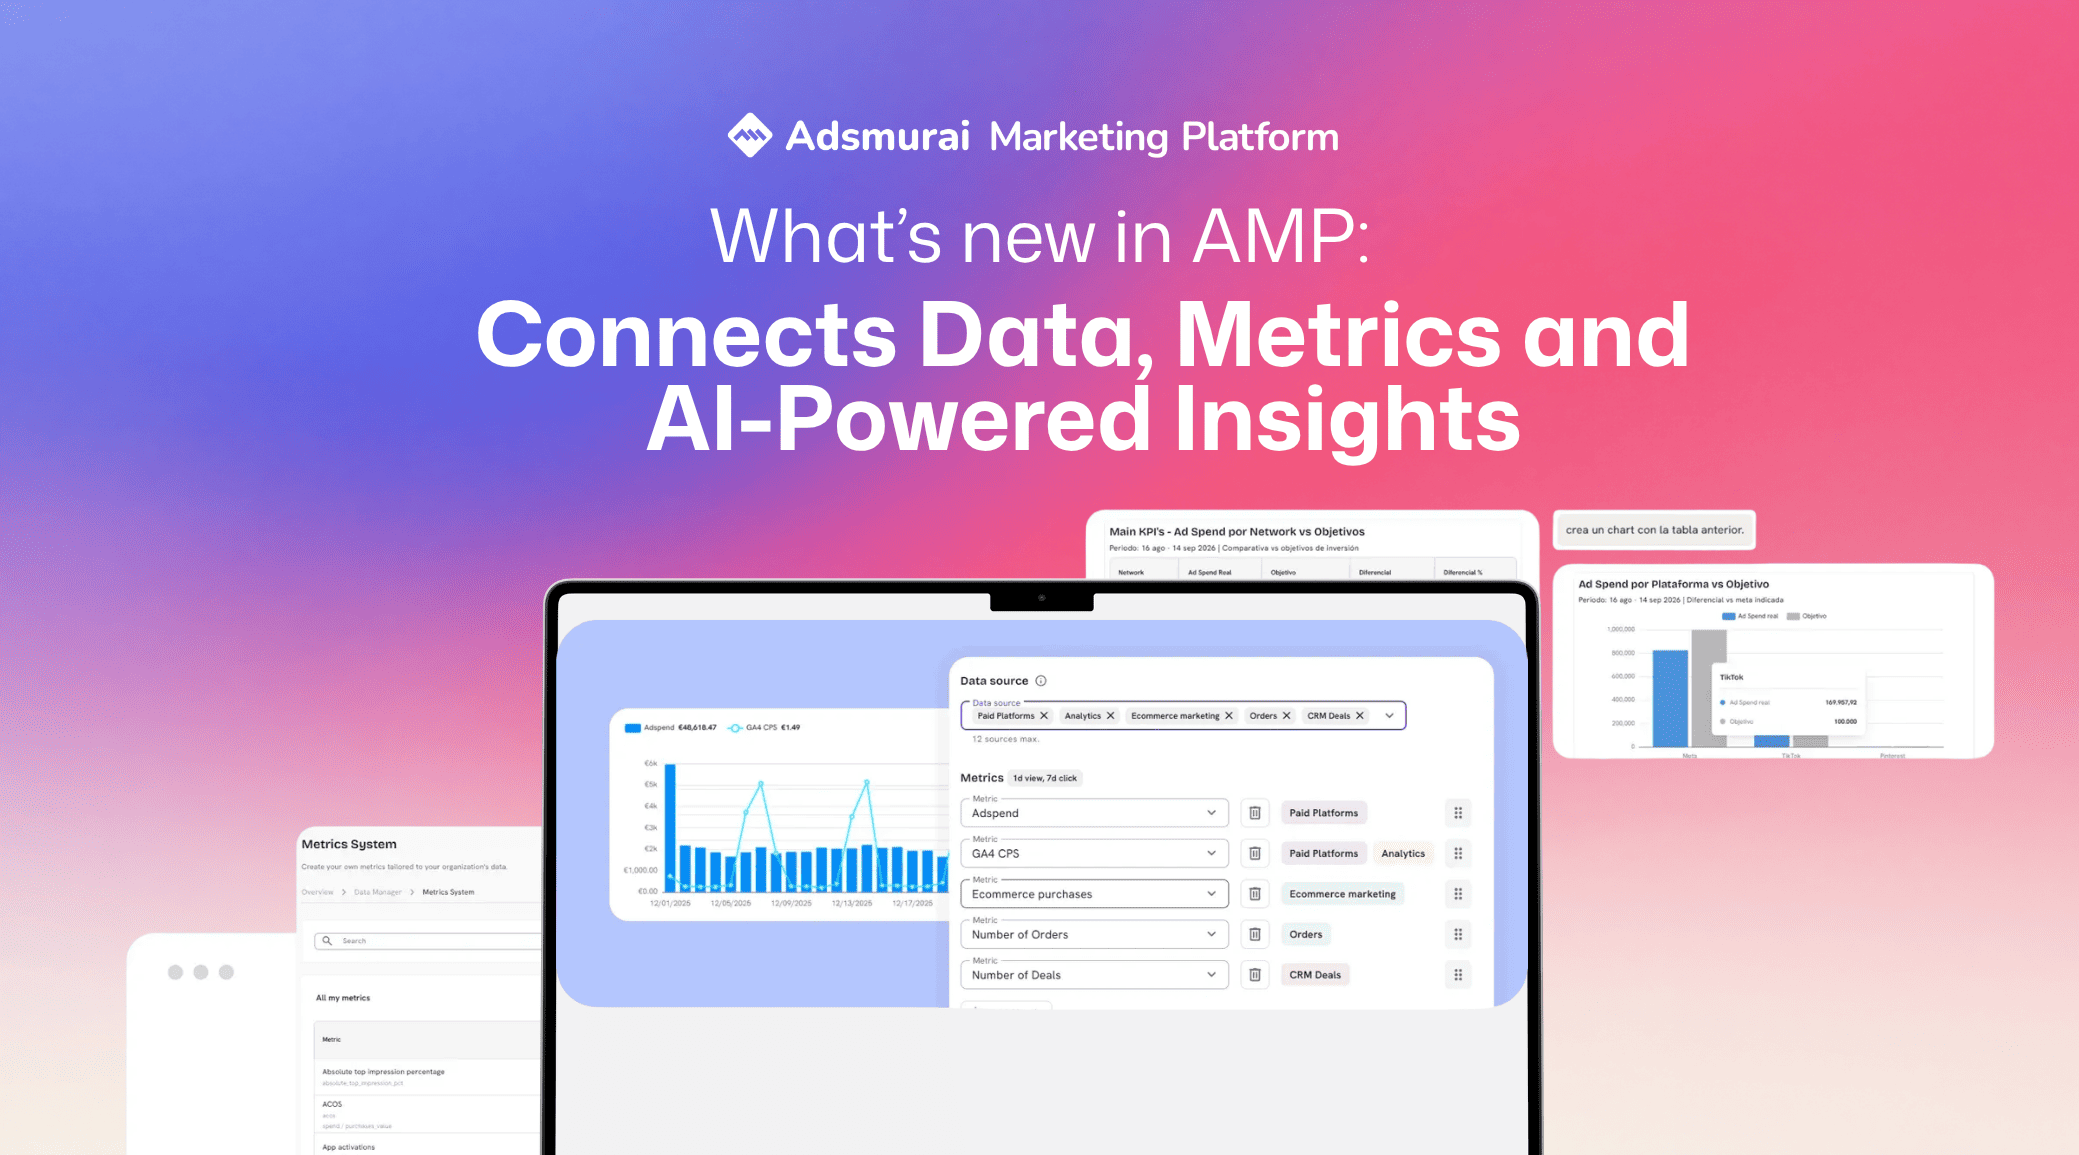
Measuring campaign performance is no longer just about knowing how much we’ve invested, how many clicks we’ve generated, or which conversions each platform reports.
The real challenge is connecting that data with what is actually happening in the business, adapting measurement to the KPIs that truly matter, and reducing the manual work required to interpret results.
The latest updates to Adsmurai Marketing Platform (AMP) move precisely in that direction: new E-commerce and CRM connections, custom metrics, cross-source analysis in Dashboards, and an evolution of Insights Generator to interpret data with much more context.
In short: more connected data, greater flexibility in measurement, and more intelligence to turn it into decisions.
1. Connect Paid Media with real sales and leads
AMP can now incorporate business data from E-commerce and CRM platforms and compare it directly with advertising investment.
With integrations such as Shopify, VTEX, and HubSpot, you can add information such as:
- Orders and actual E-commerce revenue.
- Top-selling products and product categories.
- Leads and conversions from the CRM.
- Cost per lead linked to each channel.
- Business results compared with Paid Media investment.
For more details about this feature, check out the following article: E-commerce Reporting in AMP
This makes it possible to go beyond the metrics reported by advertising platforms and gain a more complete view of the relationship between investment, marketing activity, and real business results.
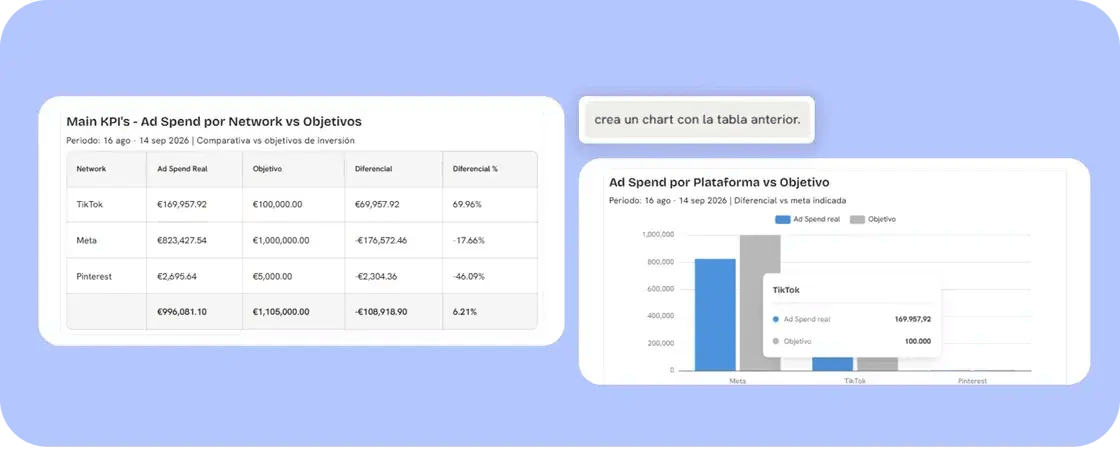
AMP is no longer limited to answering “how is the campaign performing?” and moves closer to a much more interesting question: “what is happening in the business while we invest?”
2. Create the metrics your business needs
Having more data is of little use if every organization is still measured in exactly the same way.
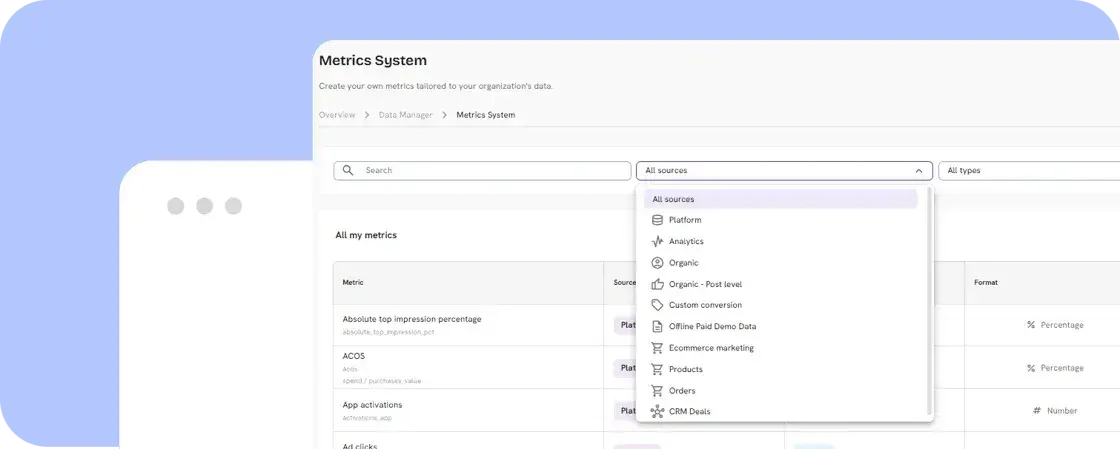
That’s why organization Admins can now manage their own metrics directly from Data Manager.
From there, they can:
- Import metrics already available in AMP.
- Configure how they should be displayed and used.
- Create Calculated Metrics by combining existing metrics.
- Build KPIs using information from different data sources.
This makes it possible to adapt AMP to each client’s specific needs and work with a measurement framework that is much more closely aligned with their actual objectives.
In other words: the business no longer has to adapt to the metrics available in the platform; AMP can adapt to how each organization needs to measure performance.
3. Combine different data sources within the same Dashboard
Dashboards continues to evolve.
Until now, it was possible to bring different sources of information together within the same Dashboard, but each widget had to work with metrics from a single source.
Now you can combine metrics from different data sources within the same visualization.
For example:
Paid Media Investment + GA4 Revenue
Paid Media Investment + E-commerce Revenue
Paid Media Investment + CRM Leads
You can also use cross-source calculated metrics previously created in Data Manager.
AMP automatically identifies which metrics, filters, and groupings are compatible across different sources and allows you to use common dimensions, such as date or country, when the fields are correctly mapped.
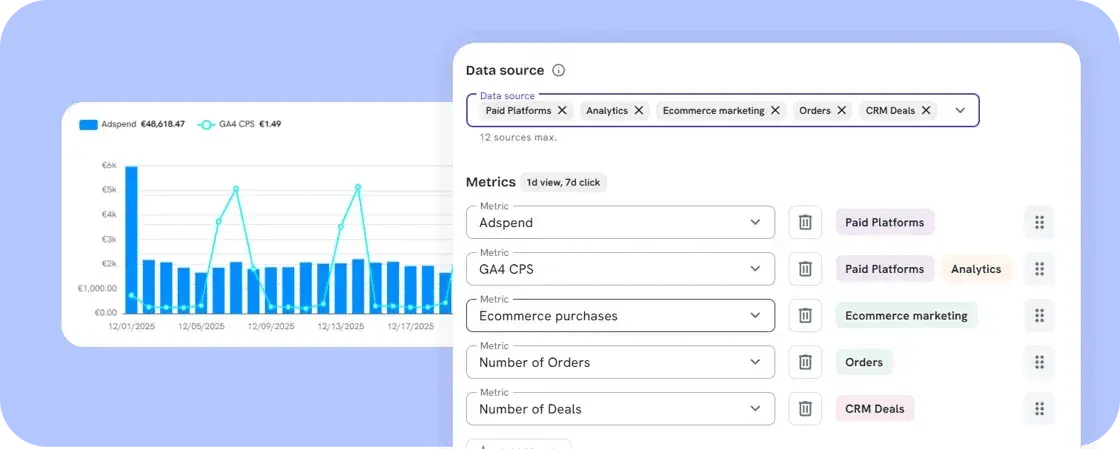
The result is more compact reporting and, above all, much more context: fewer isolated data points and a greater ability to understand how they relate to one another.
4. Insights Generator evolves into an analysis agent
Once your data is connected, your metrics are defined, and your different sources are linked, the next question is: do we still need to interpret all of this manually every week? Less and less.
We’ve evolved Insights Generator so it can perform more comprehensive analyses directly from Dashboards.
More context about what happened
Insights Generator automatically incorporates optimizations carried out across Meta, Google, TikTok, and AMP.
This means the analysis is not limited to identifying changes in metrics. It can also take into account the actions carried out during the period as additional context to better interpret the results.
External information within the analysis
You can also attach the following directly to the agent:
- PDFs.
- Spreadsheets.
- Images.
- Documents.
- Promotional calendars.
- Business data.
- Briefs or additional client information.
This allows Insights Generator to analyze Dashboard information alongside additional context that does not yet live within AMP.
More rigorous insights
We have also strengthened the instructions that guide the agent so that it:
- Bases its conclusions on the available data.
- Clearly distinguishes between facts, interpretation, and recommendations.
- Identifies when additional information is needed to improve the analysis.
You can also continue the conversation with the agent to compare periods or markets, explore a hypothesis in more depth, or generate new ways of visualizing the data.
And when you find an insight, table, or chart you want to keep, you can pin it directly to the Dashboard as a static widget.
From analyzing data to defining how we want it to be analyzed
All these updates are part of the same evolution.
The goal is no longer simply to centralize data within AMP, but to build an environment where you can:
Connect marketing and business data.
Define how you want to measure it.
Connect information from different sources.
And configure how you want AMP to analyze it.
For automated analysis, two elements become especially important:
Brand Context, which provides the agent with information about the organization, its business, and its objectives.
And Style & Format, which defines how the information in each Dashboard should be analyzed and presented.
Insights Generator can even automatically generate an initial version of the Style & Format using the Brand Context and the Dashboard structure as a reference.
The recommended flow is:
Brand Context → Dashboard → Style & Format → Plan Mode → internal and external context → Insights
An additional layer of intelligence between marketing and business
These improvements take AMP one step beyond traditional reporting.
The platform can integrate data from Paid Media, Analytics, E-commerce, and CRM; create KPIs tailored to each business; combine different sources within the same visualization; and use AI to interpret results with context.
Because having more dashboards does not necessarily mean having more answers.
The opportunity lies in building a system capable of connecting the right data, measuring what really matters, and turning that information into business decisions.
And that is exactly the direction AMP continues to evolve towards.
We’re continuing to build a platform for better decision-making
All these updates share the same goal: helping marketing teams spend less time gathering information and more time taking action.
Because when intelligence, context, and execution come together in the same platform, decisions happen faster and day-to-day work becomes much more efficient.