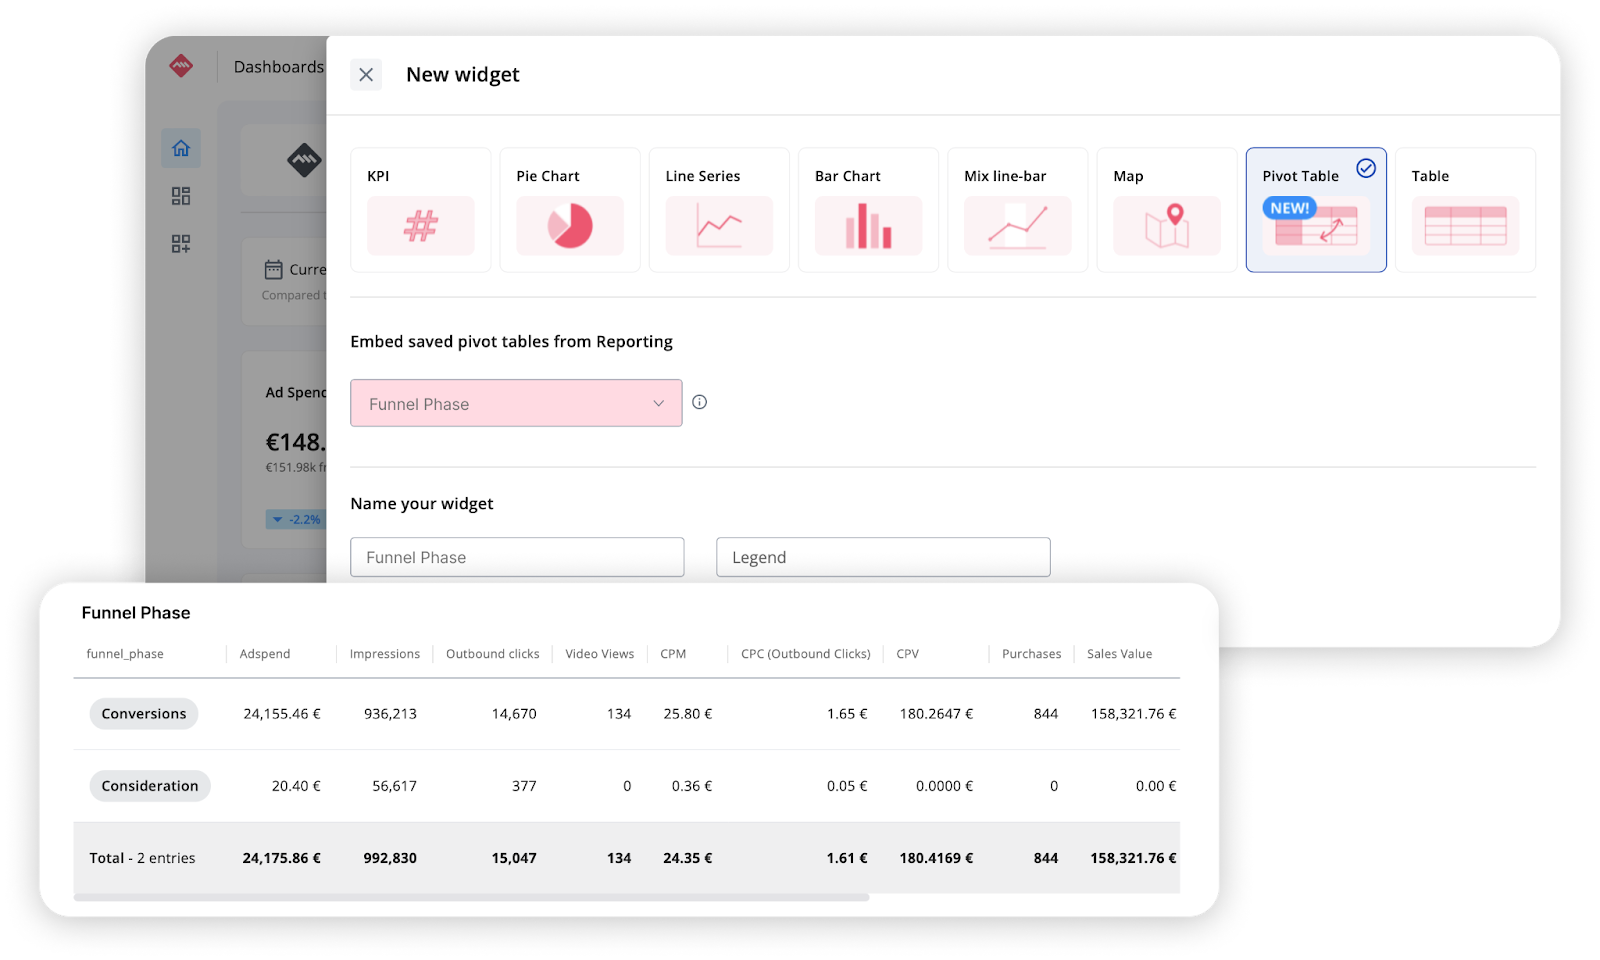
In an environment where data-driven decision making is key, having tools that offer clarity, agility and depth of analysis makes all the difference. At Adsmurai Marketing Platform, we want to help you have total control over the performance of your campaigns, that's why we have integrated Pivot Tables in Dashboards. This functionality allows you to customize and centralize your analysis to optimize strategies and save time on repetitive tasks.
What does this integration bring to the user?
The union of Pivot Tables and Dashboards transforms the way you manage your data, simplifying analysis and empowering decision making.
Here's how this functionality directly benefits your day-to-day life:
1. Comprehensive analysis from a single location
Combining Dashboards with Pivot Tables allows you to view advanced information, such as the performance of ad sets or products, directly in your dashboard. This means you no longer need to switch between tools to access the data that matters. Everything is centralized, offering a holistic view of your digital campaigns and strategies.
2. Decisions based on deeper insights
With integrated Pivot Tables, you can segment data by multiple dimensions and granularities, such as Adset, Ad or campaign naming. This allows you to better understand the behavior of your strategies and detect opportunities to improve performance.
3. Saving time and improving efficiency
Thanks to the ability to customize tables and advanced filters, you eliminate manual tasks such as extracting and consolidating data from different platforms. You can configure widgets in your Dashboards with the most relevant reports, updated in real time, to dedicate more time to strategic planning.
4. Advanced tracking with exclusive metrics
Include metrics that were previously only available in Pivot Tables, such as those based on custom attribution windows or those from integrations such as CRM. This enriches your analysis and broadens the perspectives to evaluate the impact of your campaigns.
5. Flexibility to adapt to your needs
The Pivot Tables widget settings operate independently of the filters and dates in your main Dashboard. This ensures that the information you see in each report is accurate and aligned with your specific settings.
6. Real-time comparisons and evolution
Add comparative tables to your Dashboards to track the evolution of your campaigns over time, analyzing trends and changes in performance in a visual and intuitive way.
How to get the most out of Pivot Tables integration with Dashboards
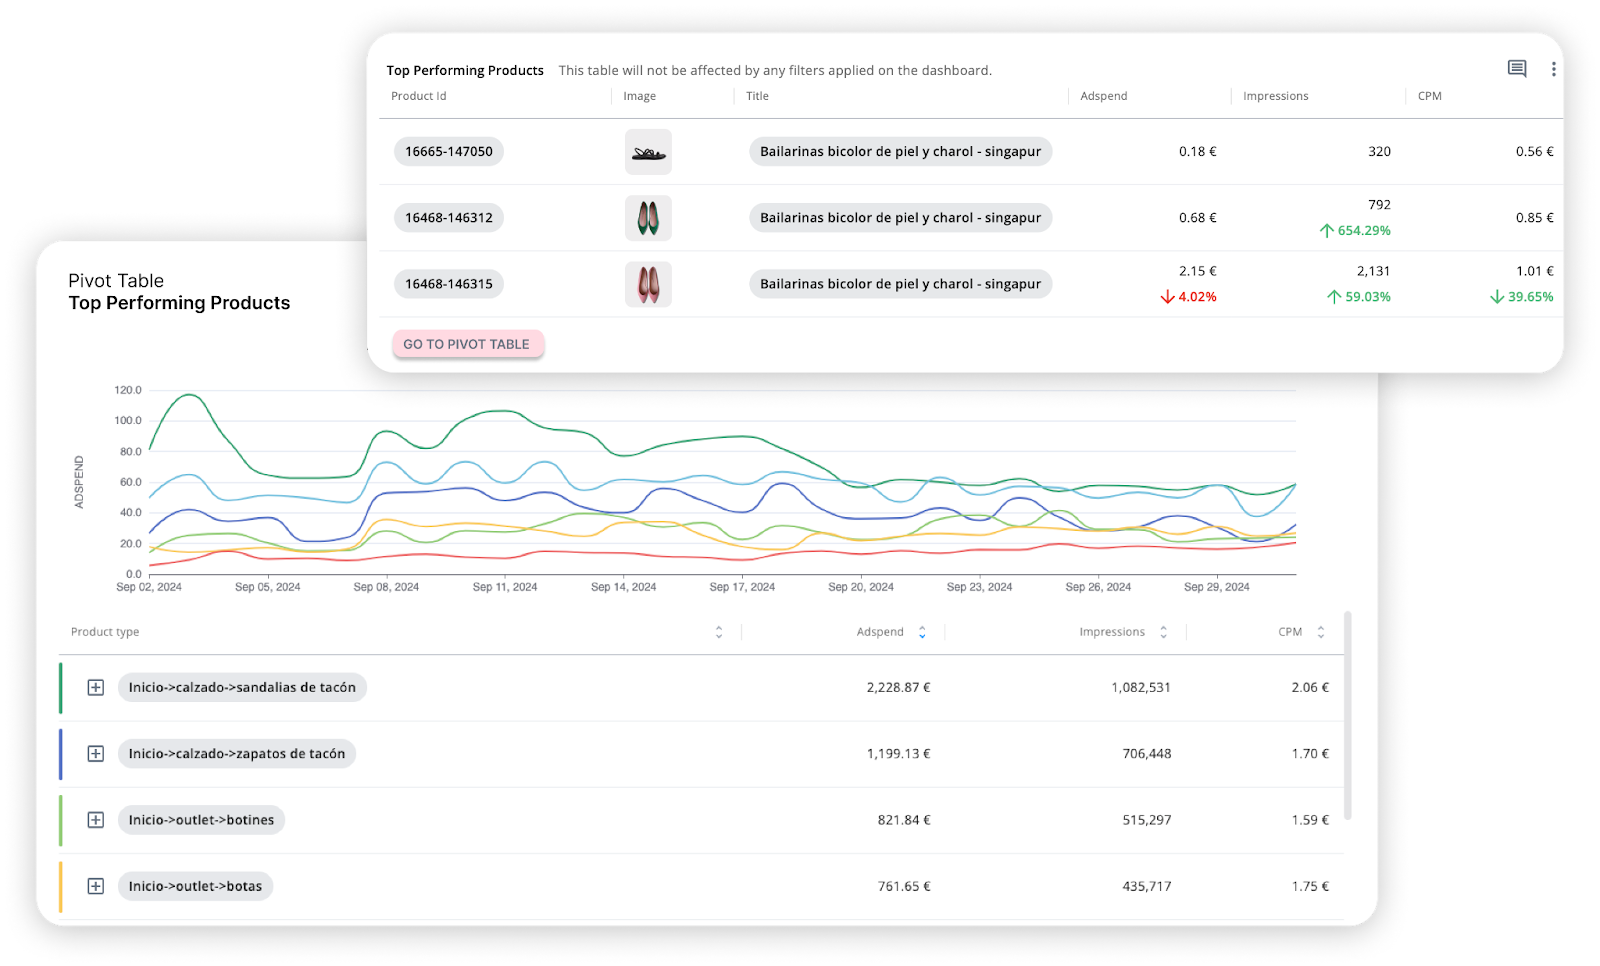
- Ranking of best-selling products: Include a widget that shows the performance of your top products (ideal if you have product analysis enabled).
- Detailed campaign tracking: Use the naming of your campaigns to group data and generate comparative analysis.
- Segmentation optimization: View tables with multiple dimensions and granularities to identify areas for improvement in your segmentation strategies.
- Customized metrics evaluation: Leverage advanced CRM metrics or specific attribution windows to fine-tune your campaigns.
This integration reinforces Dashboards as the ideal solution for monitoring, analyzing and optimizing your digital campaigns. With instant access to your key KPIs, dynamic visual representations and now the depth of Pivot Tables, you have everything you need to make faster and more effective decisions.