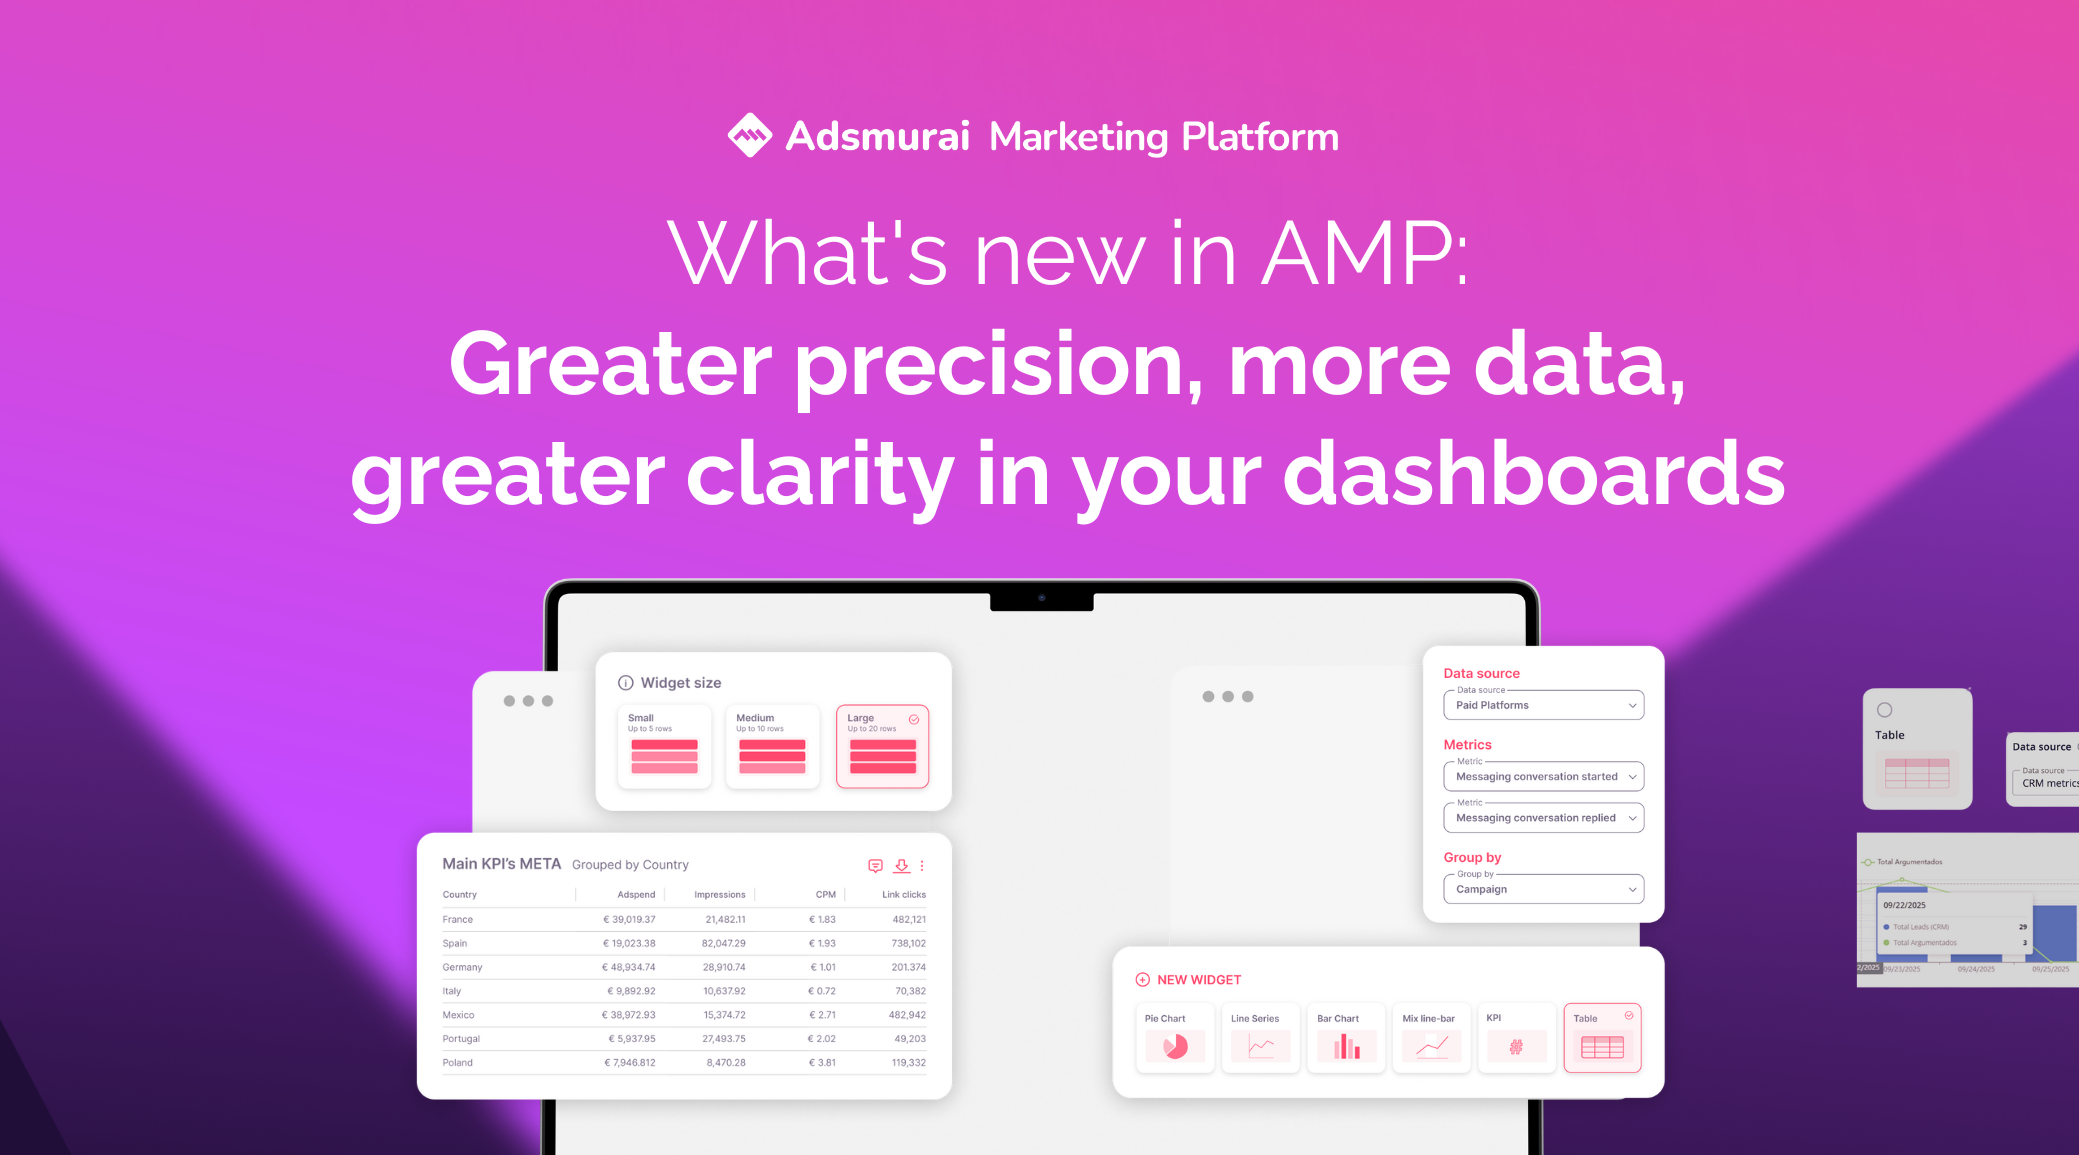
AMP Dashboards keep evolving to deliver more complete, connected, and actionable reports. Now you can analyze your campaigns with custom conversions, integrate CRM data in the same view, and work with more flexible tables thanks to new export and display options.
The result: more accurate insights, reporting aligned with your real business, and less time wasted on manual processes.
📊 Custom Conversions now available in Dashboards
AMP Dashboards takes another step forward: you can now visualize your custom conversions directly in your reports. If your organization already had them configured, there’s no more need to rely on exports or standard metrics.
With this update, reports become much more relevant because they adapt to the way each business measures success. That means greater accuracy, more useful insights, and the ability to detect differences between platforms like Meta and Google when they don’t share the same conversion language.
🎯 What changes for you
-
Reports aligned with your own KPIs, not just the default ones.
-
Sharper analysis of campaign impact with custom goals.
-
Clearer comparisons between platforms and conversion definitions.
🛠 Practical examples
-
Evaluate lead or signup campaigns based on your own conversion definition.
-
Integrate unique metrics into performance reports for clients with specific objectives.
-
Identify divergences between platforms and adjust strategies accordingly.
🚀 What you can do right now
- Add Custom Conversions to your existing dashboards.
- Create new reports with personalized metrics.
- Identify key patterns to optimize performance.
- Request activation of this feature if you don’t have it yet.

🤝 CRM metrics now available in Dashboards
From now on, AMP Dashboards incorporates CRM metrics into your personalized reports. All organizations that already had them configured can now view and analyze them directly, without switching between different tools or data sources.
With this integration, dashboards gain a broader and more complete perspective, connecting campaign data with business reality and offering analysis much more aligned with commercial goals. The result: faster decisions, based on a real snapshot of the impact of your marketing actions.
What you gain with this update:
- A single view that combines media and CRM metrics.
- Richer insights by crossing campaign performance with business data.
- Reports that reflect not just clicks or leads, but also their real weight in the pipeline.
Use cases
- Assess the impact of campaigns across the full sales cycle.
- Analyze the real quality of leads and their conversion into customers.
- Compare marketing goals with business results in an integrated way.

📋 Table improvements in Dashboards
Your tables in AMP Dashboards are now more useful and flexible thanks to two highly requested improvements:
- CSV download button → export your data easily and completely.
- New sizes: 20 and 30 rows → greater visualization range without pagination or relying on PDFs.
With these updates, we solve recurring reporting pains, such as incomplete exports or unnecessary manual processes. In addition, it simplifies the work for organizations that still manage part of their data in spreadsheets and helps save time in report preparation.
What changes in your daily work
-
Complete exports ready to work in Excel or Google Sheets.
-
Larger tables that allow direct analysis without creating multiple widgets.
-
More consistent PDFs with a greater information range in a single view.

Practical examples
-
Download client campaigns in CSV and analyze them in Excel.
-
Set tables to 30 rows for a monthly campaign-grouped report.
-
Avoid spending extra time on data that wasn’t previously visible in PDFs.
How to start using it
- Use the export button at the top right of the tables.
- Create or edit your widget and select from the new sizes available.
