There is a time of year that defines the success or failure of many e-commerce and retail businesses: the High Season or, as we call it in the industry, the Peak Season.
It’s not just a sales increase; it’s a real perfect storm. Customer expectations are higher than ever, logistics networks are at the limit of their capacity, and advertising competition becomes fierce. From the frenzy of Black Friday and Cyber Monday to the final Christmas push, every hour that passes is an opportunity for massive gains or catastrophic losses.
The real challenge in this hyper-accelerated environment is not generating demand, but managing the chaos that this demand creates. Teams are working with the pedal to the floor, and critical information – whether a stock out is imminent, whether an ad campaign is burning money, or whether the fulfillment center is about to collapse – is usually fragmented, outdated and buried under mountains of data.
How can a leader make fast, strategic decisions when the operational landscape is confusing and stressful?
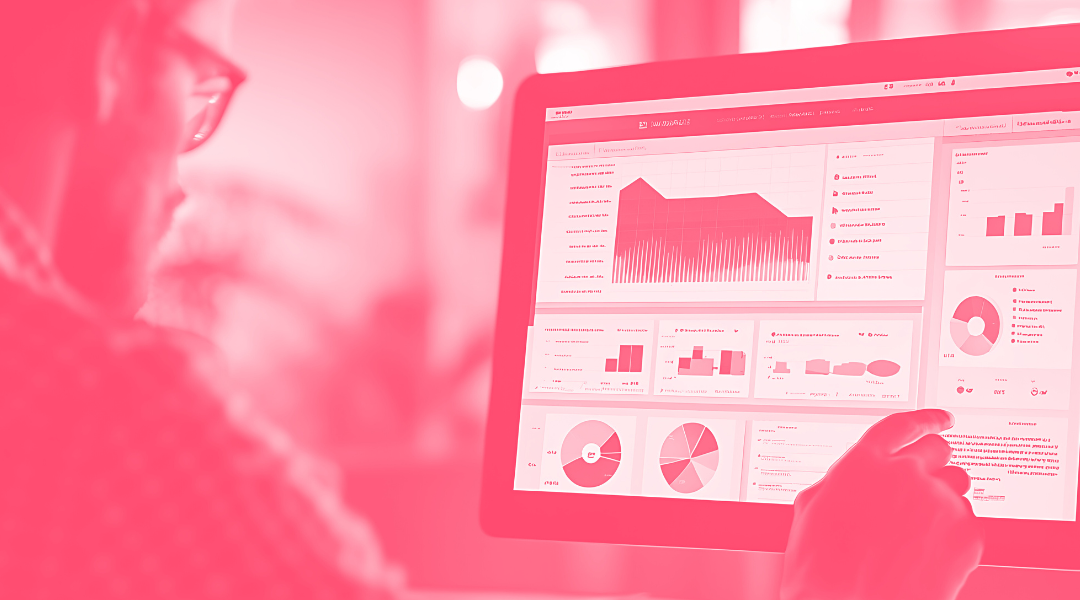
The answer to that challenge lies in a simple but powerful tool that acts like a lighthouse in the fog: the Data Dashboard. Stopping guessing and starting to see clearly is the first step to mastering the most important season of the year.
TABLE OF CONTENTS
-
The uncomfortable truth: you’re not lacking information, you’re lacking control
- What is a Dashboard and why is it vital in Peak Season?
- Centralised spend control with Adsmurai Marketing Platform
The uncomfortable truth: you’re not lacking information, you’re lacking control
Peak Season is the time of year when data stops being a resource and becomes a matter of survival. There is no room to interpret for hours, no time to export massive spreadsheets and no capacity for four teams to argue over different versions of reality.
The typical situation looks like this:
- Marketing says the campaign is performing well.
- Ecommerce insists something is wrong at checkout.
- Operations claims inventory is under control.
- Customer support sees tickets doubling.
And by the time someone can finally review everything together… sales have already been lost, budget has been burned and the team is two coffees past the limit.
The problem is not a lack of data, but that it is fragmented, outdated and isolated.
You don’t need more information, you need more clarity. A single source, a single narrative, a clear and unequivocal reading.
That, and only that, allows you to lead in the middle of the storm.

What is a Dashboard and why is it vital in Peak Season?
A dashboard is a visual interface that consolidates the most critical metrics of your business into a single screen, updated in real time. Think of it as the cockpit of an airplane: it doesn’t show everything, only what the pilot needs to fly safely and efficiently.
In high season, its role is threefold:
- Real-Time Visibility: It removes delay. If an email campaign fails or the warehouse stops, you see it in the moment.
- Action Focus: By displaying only the KPIs (Key Performance Indicators), it forces you to focus on what you can change.
- Clarity in the Chaos: It reduces team anxiety by providing a reliable, objective “single source of truth”.
The 4 Pillars of Total Control with Dashboards
To have total control, you need to build dashboards focused on the areas that create the most stress during the sales peak:
1. Sales and E-commerce: the heartbeat of the business
This is the first dashboard the CEO and marketing team should look at.
|
Key Metric |
Why it matters in Peak Season |
|
Conversion Rate (CR) |
If it drops, it indicates a critical issue on the website (e.g. slowness, broken checkout). |
|
Average Order Value (AOV) |
It tells you whether your bundles and cross-sell strategies are working. |
|
Sales per Hour |
It allows you to predict peaks and troughs in demand so you can adjust stock and staffing. |
Nothing here is negotiable.
Conversion rules. AOV defines profitability. Sales per hour tell you whether you’ll make it through the day or need reinforcements.
A drop in CR is a siren. A weak AOV is a strategy alert.
An unexpected spike in sales can mean glory… or an imminent stock out.
2. Logistics and operations: the promise delivered
You can sell a lot, sure.
But if you don’t deliver well, Peak Season becomes your returns season.
Here you need to see:
- Real-time order fulfillment.
- Critical inventory levels, by the hour.
- Error rate in shipments.
Every minute counts. Every delay costs.
A logistics dashboard is the key to customer satisfaction.
- Order Fulfillment Rate: Percentage of orders processed and dispatched on time. A red light here means you need to reassign staff immediately.
- Critical Inventory Level: It not only shows quantity, but how many hours/days of sales you have left for your Top Sellers. It prevents the dreaded Stock Out.
- Order Error Rate: It measures whether the wrong product is being sent or shipments are going to the wrong address. Errors skyrocket under pressure.
3. Marketing and advertising: the growth engine
Ad spend in Peak Season is a surgical operation. You can scale up or you can burn through your budget. Everything depends on three metrics: ROAS, CAC and traffic vs sales.
And it’s not enough to see them: you have to understand them. Who converts, where, how and why.
Ad spend is the biggest financial risk during this period.
- Return on Ad Spend (ROAS): This is king. Does every euro invested generate enough sales? If ROAS drops too low, you need to pause or adjust the campaign immediately.
- Customer Acquisition Cost (CAC): It ensures you’re not overpaying for a new customer due to intense bidding competition.
- Traffic vs. Sales: It shows whether your investment is driving visits or actual buyers.
4. Customer support: retention in action
An increase in tickets is the exact X-ray of your operational issues. If FRT goes up, you lose conversions. If tickets pile up, you lose reputation.
Dashboards should alert you before damage becomes visible. Poor customer service during Peak Season can wipe out the profit from your sales.
- Open Tickets Volume: A spike may indicate a systemic issue (e.g. delivery delays or a defective product).
- First Response Time (FRT): Keeping it low ensures that customer questions don’t turn into abandoned carts or negative reviews.
Centralised spend control with Adsmurai Marketing Platform
For companies that invest heavily in digital advertising, managing advertising performance is the most expensive bottleneck. Marketing technology platforms such as Adsmurai perfectly illustrate how a specialised dashboard can turn complexity into control.
✔ A unified, cross-platform view that avoids “triple interpretation”
Meta says one thing and Google another?
TikTok doing its own thing?
Your CRM telling a different story?
With AMP, everyone speaks the same language.
✔ Creatives, audiences and campaigns in a single narrative
AMP doesn’t just tell you how much you spent.
It tells you which creative lowers CAC, which audience is scaling, which combination performs best.
And it lets you act on the fly.
✔ Critical alerts that don’t wait until you review them
A campaign drops below your minimum ROAS: alert.
Your CAC shoots up: alert.
Performance changes dramatically: alert.
In Peak Season, smart alerts are worth more than a thousand reports.
From data to decisions: the power of Intelligence in the Dashboard
The real value of a dashboard, is not just in showing numbers, but in its ability to transform raw data into actionable intelligence directly on the same screen.
🔍 Explore Every Level of Your Data
A powerful platform lets you go beyond overall ROAS and explore every level of your data with complete agility, without the need to download massive spreadsheets.
- Granular Level (Creative): Which headline, image, or call-to-action color is generating the highest CTR right now? The dashboard shows you with dynamic visualizations and customizable metrics.
- Intermediate Level (Audience/Segment): Is investing in Instagram's lookalike audience performing better than Facebook remarketing? The segmentation capabilities allow you to reallocate your budget immediately.
-
Aggregate Level (Full Campaign): Visualize the total impact of a campaign (cross-channel) to determine whether it should remain active or if its budget should be reallocated to another operational priority.
Automated Insights and recommendations
In the frenetic pace of peak season, there's no time to manually analyze every trend. This is where the platform's integrated Artificial Intelligence (AI) comes in.
- Anomaly Identification: The system can automatically alert you if it detects an unusual spike in Cost Per Acquisition (CAC) or a drop in Return on Assurance (ROAS), suggesting a possible pause or bid adjustment.
- Rapid Validation: If the marketing team proposes increasing investment in a campaign, the dashboard provides immediate validation based on current profitability, eliminating guesswork.
By centralizing analysis, the platform ensures that decisions are based not only on what is happening, but also on what should be happening to continuously optimize profitability.
From Reaction to Proactivity
Total control at Peak Season doesn't mean micromanaging every order; it means having the right information, at the right time, to make the right decision.
By implementing specialized dashboards for each critical area, you transform the work environment, moving from a state of stressful reaction to informed proactivity. The chaos dissipates, and decisions—whether it's increasing stock, reallocating budget, or reinforcing the warehouse—become clear, quick, and, above all, profitable.
Is your business ready to face the next peak season with data, or will it continue to navigate blindly?