
Migrating from Universal Analytics to Google Analytics 4 (GA4) can be a transformative step for your data analytics. However, amidst the excitement of this transition, it's crucial to address a critical challenge - data retention. Once you have it, what needs to be clear is that you need the data to be structured clearly, concisely and visually easy to interpret.
TABLE OF CONTENTS
- Data retention in Google Analytics 4
- Leveraging BigQuery for data retention
- Introducing Looker Studio for real-time data visualization
Data retention in Google Analytics 4
When it comes to Google Analytics 4 (GA4), understanding data retention is key. GA4 introduces a distinct data retention policy compared to its predecessor, Universal Analytics.
Unlike Universal Analytics, which allowed for indefinite data retention, GA4 implements a different approach. GA4 has a default data retention policy of 14 months. This means that any data older than 14 months will automatically be deleted from your GA4 reports.
Why is it essential to act now?
-
Retain valuable historical data:
Your historical data is a treasure trove of insights. By taking action to optimize your data retention settings, you can ensure that valuable historical data remains accessible. This is particularly crucial for trend analysis, long-term performance assessment, and compliance with data retention regulations.
-
Maximize the 14-month window: The default 14-month data retention period can be limiting if you don't take action. By configuring your GA4 settings appropriately, you can make the most of this period and avoid the inadvertent loss of valuable data.
-
Unleash the power of real-time data: GA4 offers advanced integration with tools like Google BigQuery and Looker Studio. These integrations not only preserve your data but also enable real-time analysis and deeper insights. To fully leverage these capabilities, ensuring data retention is key.
How to optimize data retention in GA4
Configuring your data retention settings in GA4 is a straightforward process. Here's how you can do it:
-
Log in to your GA4 property: Access your GA4 property using your Google Analytics account.
-
Go to admin settings: In the admin section, navigate to the property for which you want to configure data retention.
-
Data retention settings: Under the "Data Settings" tab, you'll find the "Data Retention" option.
-
Choose your retention period: GA4 provides several options for data retention periods. You can select from:
-
2 months
-
14 months
-
-
Save your settings: After selecting your desired retention period, click "Save" to apply the changes.
In the world of Google Analytics 4, data retention is a strategic consideration. By understanding the policy nuances, taking action to optimize your retention settings, and leveraging advanced integrations like Google BigQuery and Looker Studio, you can unlock the full potential of your GA4 data. Remember, it's not just about preserving data; it's about harnessing it for actionable insights that drive your organization's growth and success.
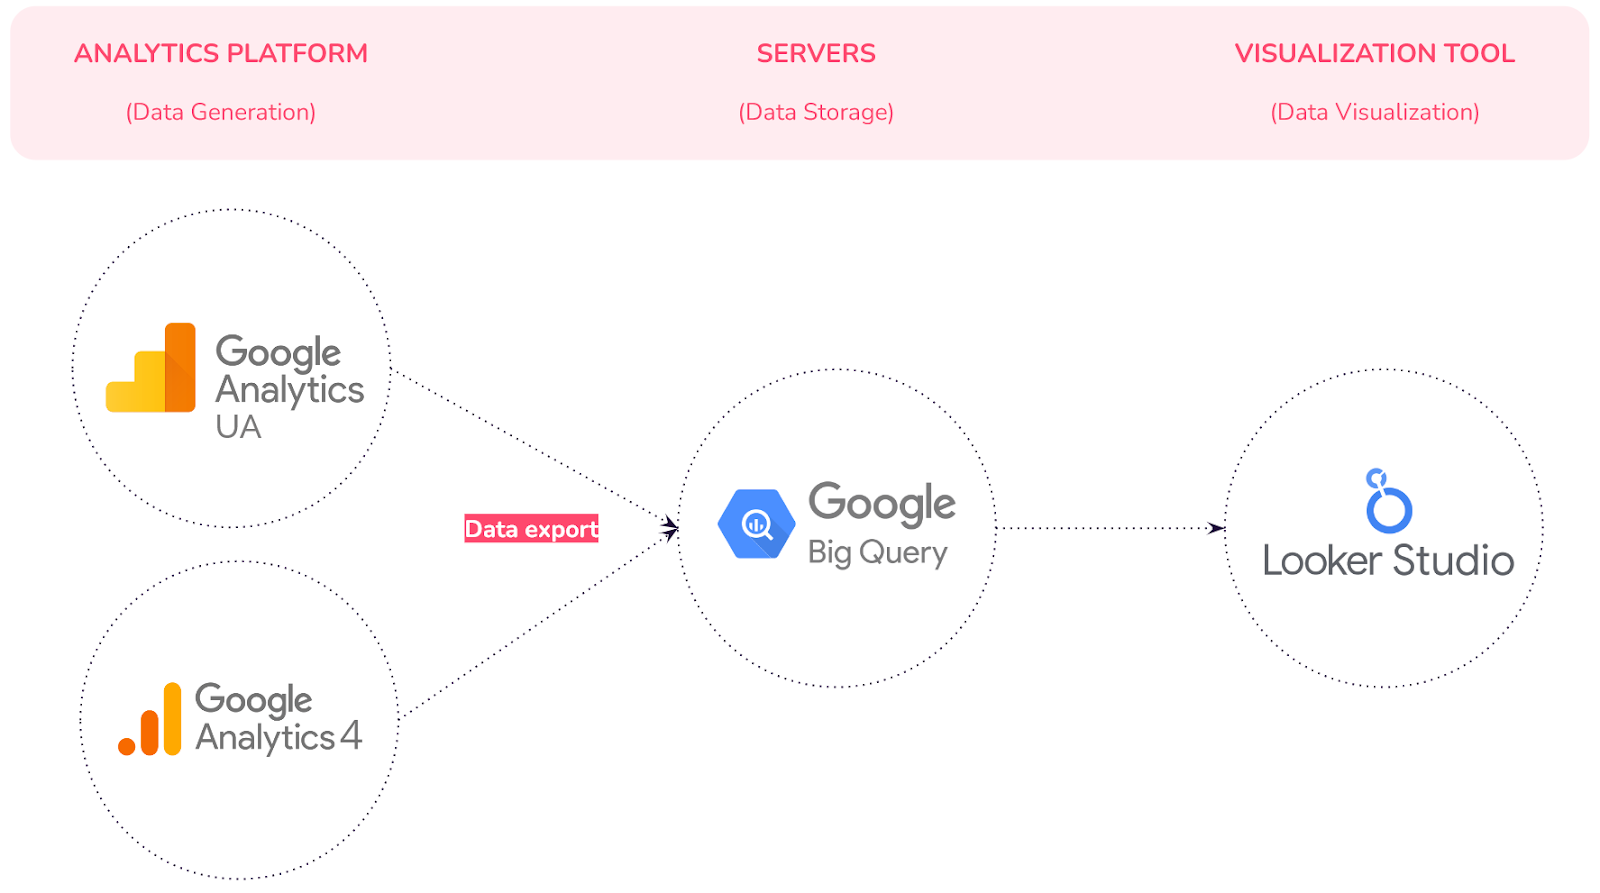
Leveraging BigQuery for data retention
As you finish the journey of migrating to Google Analytics 4 (GA4) and start to ensure data retention, one indispensable tool stands out - Google BigQuery. It's not just a data storage solution; it's a powerhouse that can transform the way you manage and analyze your data.
Google BigQuery stands as a robust data storage and management system, streamlining the process of consolidating data from diverse sources for reporting and analysis. Its exceptional storage capacity and lightning-fast query capabilities are invaluable to data professionals.
Why should you enable BigQuery linking for GA4?
-
Data storage flexibility: Google BigQuery serves as a centralized data repository. It allows you to store your GA4 data securely in Google Cloud or even send it to data warehouses. This flexibility ensures that your data is not only preserved but also accessible where you need it.
-
Data freshness: GA4 will not retain our data in the interface as UA did. Information older than 2 months (or 14 months, depending on your configuration) will gradually be deleted. It's essential to keep GA4 connected to BigQuery to ensure the ongoing freshness and retention of our data.
-
Real-time data: Unlike UA, GA4 doesn’t process real-time data. By using BigQuery to store data is it practically possible to have real-time control. This is crucial for staying up-to-date with user behavior and avoiding the delay of days/horas on GA4.
-
Data enrichment: The real magic of BigQuery happens when you start merging and enriching your GA4 data with other critical datasets. Whether it's marketing data, CRM information, or contextual data, BigQuery empowers you to create a comprehensive data landscape for more profound insights.
-
Data visualization: Visualizing your data is crucial for making informed decisions. BigQuery seamlessly integrates with popular data visualization tools like Looker Studio or Adsmurai Marketing Platform. This means you can turn your data into meaningful, interactive visualizations that drive action.
-
Advanced analysis: BigQuery is not just about storage; it's about advanced data manipulation. With its robust query capabilities, you can perform complex analyses that were previously out of reach. Merge data sources, perform cohort analysis, and uncover hidden patterns in your GA4 data.
As you embark on your migration journey, remember that data retention is not just about preserving the past; it's about shaping your future. Google BigQuery empowers you to harness the true potential of your data. So, take advantage of this powerful tool and steer your organization toward data-driven success.
Introducing Looker Studio for real-time data visualization
Once you have managed to extract and retain your data, it is time to visualize them. In the world of data analytics, visualizing data isn't just a luxury—it's a necessity. It's the bridge that transforms raw data into actionable insights, and it's the language that speaks to every member of your team, from juniors to managers. That's where Looker Studio comes into play.
Looker Studio is a powerful, free tool that takes your data and transforms it into informative, easy-to-read, customizable dashboards and reports. With Looker Studio, you can:
-
Visualize your data: Create highly configurable charts and tables that bring your data to life.
-
Connect to various data sources: Easily access and integrate data from a variety of sources, including Google BigQuery.
-
Share insights: Share your insights with your team or even with the world, making data-driven decision-making accessible to all.
What's even more exciting and important in this blogpost is the seamless integration between Looker Studio and Google BigQuery. While Universal Analytics (UA) might lack a direct connector, necessitating external assistance to retrieve historical data, GA4 offers a direct link to BigQuery. This commonality in both scenarios underscores the desire to visualize data seamlessly in Looker Studio.
With Looker Studio, you're not limited to just one source of data. You can create dashboards from both Universal Analytics and GA4 data. This means you can continue to access and analyze your historical data from UA while also harnessing the power of GA4. While the GA4 interface might not provide real-time data, Looker Studio can bridge that gap because it's connected directly to BigQuery.
In a single platform, you can have access to your entire analytics history, encompassing both Universal Analytics and GA4. You can compare and contrast data, gaining a holistic view of your analytics landscape. With Looker Studio, you'll have the tools you need to explore, visualize, and gain insights from your data efficiently and effectively.
The importance of data visualization is simple: it helps people see, interact with, and understand data better. With Dashboards by Adsmurai Marketing Platform you can easily visualize the main key performance indicators of your campaigns and discover best performing channels or time periods and compare results. Whether your data is simple or complex, the right visualization can get everyone on the same page, regardless of their level of experience. It transforms rows and columns into actionable insights, fostering better decision-making and collaboration within your organization.