
The evolution of web analytics from the familiar practices of Universal Analytics to the introduction of Google Analytics 4 has marked a significant milestone in data collection and visualisation.
However, this transition has not been without its challenges. In this article, we will explore in depth how GA4 has changed the landscape of web analytics and how, despite its advantages, it presents challenges in visualising and leveraging data. We will discover how the combination of Google Analytics and Looker Studio offers a comprehensive solution to overcome these barriers and empower real-time decision making in a data-driven world.
TABLE OF CONTENTS
-
Key differences in data visualisation: Universal Analytics vs. Google Analytics 4
-
Advantages of integrating Google Analytics 4 with BigQuery for data visualisation 2
-
Conclusion: The combination of Google Analytics 4 and Looker Studio as an all-in-one solution
Key differences in data visualisation: Universal Analytics vs. Google Analytics 4
It is important to note that the transition from Universal Analytics to Google Analytics 4 (GA4) has brought with it significant differences in data visualisation, which can be a challenge in making quick decisions in digital marketing projects. Here, we will look at some of the main differences that users may encounter when working with Google Analytics 4 compared to Universal Analytics:
Data processing time
At Universal Analytics, we used to receive data at the interface within a few hours, usually around 4 hours. This allowed quick decisions to be made based on the information gathered.
In GA4, the data processing time is significantly longer, typically 24-48 hours. This delay is due to a more complex event-based data model. As a result, it can be problematic for campaigns that require quick responses, such as during the Peak Season.
Sampling
Whereas in Universal Analytics data used to be available in its entirety, without sampling, unless there was an exceptionally large amount of data, in Google Analytics 4, when a certain threshold of data is exceeded (usually 10 million events or more), the system resorts to sampling. This means that only a representative part of the data will be analysed and displayed. Sampling is used to speed up data processing time, but can lead to a loss of detail in reporting.
Data threshold
Reports in Universal Analytics used to show data in full, without requiring aggregation. In GA4, reports do not show complete data unless they meet a minimum aggregation threshold. This can result in a lack of detail in reports, making it difficult to obtain accurate information in certain cases.
Real-time reporting
Universal Analytics offered real-time reports that provided detailed metrics and dimensions, allowing for more comprehensive real-time monitoring. While GA4 also offers real-time reports, these reports provide basic metrics and dimensions and lack detail. In addition, they only provide data for the last half hour, which limits their usefulness for quick decision making.
The transition to Google Analytics 4 has involved significant changes in data visualisation compared to Universal Analytics. While it offers advantages in terms of data modelling and advanced functionality, such as event tracking, longer processing times and limitations in data presentation can pose challenges in situations where speedy decision-making is essential.
Advantages of integrating Google Analytics 4 with BigQuery for data visualisation 2
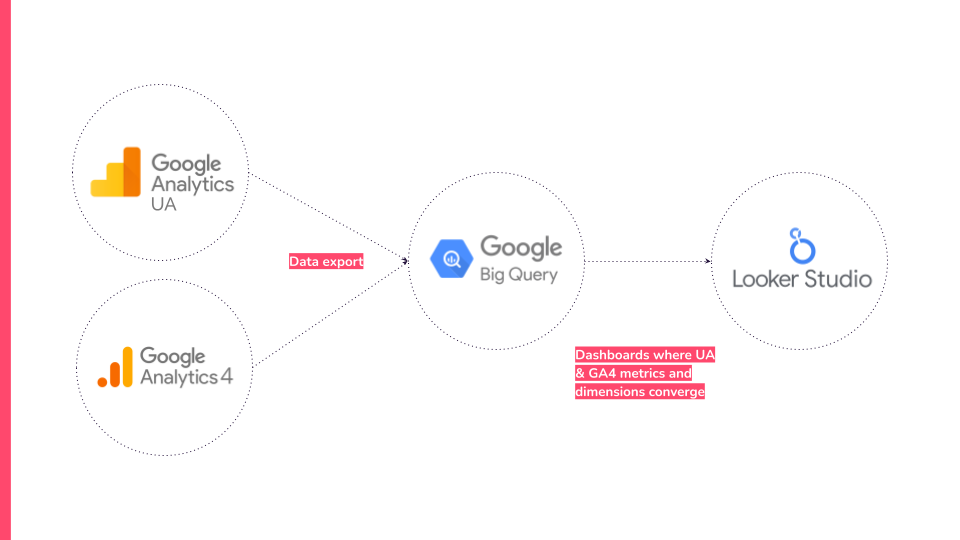
In the transition from Universal Analytics to Google Analytics 4 (GA4), we discussed key differences in data visualisation that can present challenges, such as longer processing times, data sampling and limitations in real-time reporting. However, a recommended solution to overcome these limitations is integration with BigQuery for data retention, followed by connection to Looker Studio for visualisation.
Using BigQuery as an intermediary allows us to avoid these restrictions, as the data is processed and stored in BigQuery instead of using the native GA4 connector. This means we can access more data without worrying about restrictive quotas, which is especially useful for companies with large volumes of data.
On the other hand, Google Analytics 4 has a limited data retention period, which is generally set at 14 months. In the Google Analytics 360 version, data is limited to 50 months. However, by connecting GA4 to BigQuery, the data is stored in the cloud, which ensures that no valuable information is lost after that period. This is essential for historical analysis, long-term trend tracking and meeting long-term data retention requirements.
Another significant advantage of using BigQuery is the ability to have real-time or streaming data. Unlike the daily export limitation of 1 million events in BigQuery, data in BigQuery is continuously updated as it arrives, providing a real-time view of user activities. This is particularly valuable for situations where quick decision-making is essential, such as Black Friday campaigns or sales.
By storing data in the cloud with BigQuery, local storage costs are reduced and data is easily accessible for distributed teams. In addition, Google Cloud infrastructure offers scalability and reliability, ensuring constant access to data without interruption.
By adopting this strategy, companies can overcome the limitations associated with Google Analytics 4 and take full advantage of data to make more informed and strategic decisions.
Looker Studio: Turning data into actionable insights
Looker Studio, formerly Google Data Studio, is a powerful data analysis and visualisation tool developed by Google that enables users to transform data into easy-to-understand and share information. This platform offers a number of key features and capabilities for creating interactive dashboards, custom reports and compelling visualisations.
Connecting BigQuery to Looker Studio
One of the most outstanding features of Looker Studio is its ability to connect directly to BigQuery, one of the most powerful data sources in the Google Cloud. This has a number of advantages:
-
BigQuery data exploration: Looker Studio allows you to explore and visualise data directly from the dataset stored in BigQuery. This connection translates into direct access to fresh, detailed data, facilitating data-driven decision making.
-
Full customisation: Integration with BigQuery provides the ability to create fully customisable reports and dashboards. Users can design custom dashboards to suit their specific needs and apply their brand identity.
-
Facilitates data-driven decision making: By connecting BigQuery with Looker Studio, marketers and analysts gain a powerful tool for making data-driven decisions for their customers and brands. The ability to work with real-time data from BigQuery becomes a valuable asset for fast and effective decision making.
Creating dashboards and data panels in Looker Studio
Looker Studio offers a number of key features for creating dashboards and data dashboards:
-
Looker Studio stands out for its user-friendly interface, which makes it easy to connect to data sources, create reports and dashboards, and share them with other users. This means that both technical and non-technical users can leverage the tool for their analytical needs.
-
It offers a wide variety of visualisation options, including graphs, charts and maps. These visualisations are highly customisable, allowing users to tailor them to their specific requirements and brand aesthetics.
-
It can connect to more than 800 different data sources and has more than 600 data connectors. This makes it easy to bring all of a user's data together in one place and ensures up-to-date data is available.
-
The platform allows users to easily share reports and dashboards with others. This encourages collaboration on data analysis and visualisation projects, which is essential for multidisciplinary teams.
-
Reports and dashboards created in Looker Studio are easily accessible from any device, as it is a web-based tool. This ensures that users can access data and analysis anytime, anywhere.
As you've seen, Looker Studio is a versatile tool that makes it easy to create interactive dashboards, custom reports and engaging visualisations. The connection to BigQuery and the customisation, collaboration and accessibility features make Looker Studio a valuable tool for professionals looking to make sound data-driven decisions and communicate their findings effectively.
Real-time insights with Looker Studio 4
Looker Studio excels in its ability to provide real-time insights, allowing users to access and analyse fresh and constantly evolving data. This is achieved through connection to BigQuery and data streaming, thus eliminating the daily export limit often found in other data analytics platforms.
At the core of this functionality is data streaming in BigQuery, where data is updated in real time as it enters BigQuery. This feature is essential in situations where data velocity plays a crucial role, such as Black Friday campaigns or sales.
The streaming capability ensures that data is always up to date, allowing users to view and analyse data in real-time. This gives them the ability to make decisions based on current and accurate information, which is particularly valuable in industries such as e-commerce, where trends are constantly changing.
A key benefit of implementing data streaming in Looker Studio is the elimination of the daily export limit. On many platforms, exporting large volumes of data on a daily basis can be a challenge due to imposed export limits. However, Looker Studio circumvents this problem by accessing data directly in BigQuery via streaming. This removes the daily export restriction and allows uninterrupted access to the data, regardless of volume.
The elimination of the daily export limit results in greater scalability, which is especially beneficial for companies that handle large data sets. By not being restricted by the daily export, users can perform in-depth analysis and scale their data operations effectively.
The ability to access real-time data provides a significant advantage in decision-making. Marketers can adjust their strategies in real-time based on user behaviour, which can make all the difference in key campaigns.
Conclusion: The combination of Google Analytics 4 and Looker Studio as an all-in-one solution
It is not only important to be present at all stages of the purchase funnel, but also to stand out in each of them so that Pinners notice your ads over those of your competitors.
In important seasons such as the sales, you should take care of your Pinterest creatives. Here are three recommendations that will take your sales campaigns on the platform one step further.
Learn from insights and moments
The integration of Google Analytics 4 (GA4) with Looker Studio via Big Query presents itself as a comprehensive solution for data visualisation and utilisation. This alliance breaks down barriers by removing limitations such as data sampling, quotas and data retention. The elimination of the daily export limit and the ability to access real-time data are key factors in making informed decisions in an ever-changing data environment.
The combination of these two powerful tools provides a complete solution for turning data into useful and essential information for marketers, data analysts and cross-functional teams.